Functions are fun to play with. Just watch kids sitting around a graphing calculator. The more math you know the more fun you can have. Even better with the power of computers you can play with ideas that you do not (yet!) understand. Especially when you can engage actively so get to it…(click below to head to the desmos graphing calculator)
 As you play…wait you did click and play didn’t you? Go back and do so at once!
As you play there are two interesting creative directions to try, exploring and mapping. In the first you just try things to see what will happen, in the second you try to gain control. For the first anything goes, for the second you often way to try the simplest thing you can. Talking of which ready to play again?

This time you were playing with a function from the plane to the plane. We can’t draw a standard graph for those without seeing four dimensions. I have tried and tried but can’t do that. So we have to be more creative, there are a few ways, but this works by showing how an understandable image changes.
You might have noticed that this does not always work, for some functions you enter the image goes wrong. For example try
=\sin \left(\frac{y}{8}\right)\cos \left(\frac{x}{8}\right)")
and
=\cos \left(\frac{y}{8}\right)")
can you work out why, and how this might be avoided (or used to advantage)?
To finish lets introduce one more chart. This one plays with parametric equations where both the x and the y positions of a point are described by functions. If you investigated the first chart you might have seen them already. Parametric equations often have a point moving at different speeds along the line, which you can see here, the function thinks all the circles are equally spaced:

Another example to try here is:
=\sqrt{x}\sin \left(2px\right)")
=\sqrt{x}\cos \left(2px\right)")
These notes, explore further working through some classic functions and starting to control the image, to me the balance between wild play/exploration and control/understanding creates the space where art can happen.
If you find functions you really like with the second method send me the details and I will create a laser cut version (demand permitting).
Notes
I have been working on the exploration of functions found here for some time, the ideas were originally developed along with David Celento and Brian Lockyear for a workshop at Acadia 2012. Sam Shah also used the ideas for student projects.
The main problem was that they were only implemented in Mathematica. Telling people “Here’s this cool idea, but you need expensive software to run it” just did not seem to work for some reason. Coming across the beautiful Desmos finally got me to create a more accessible version. Though there is no reason that I could not have made on in Geogebra and I plan to. Let me know if there are other formats that might be useful. I am also looking for help from teachers to connect these ideas to the classroom.


=\sin(x)") :
:
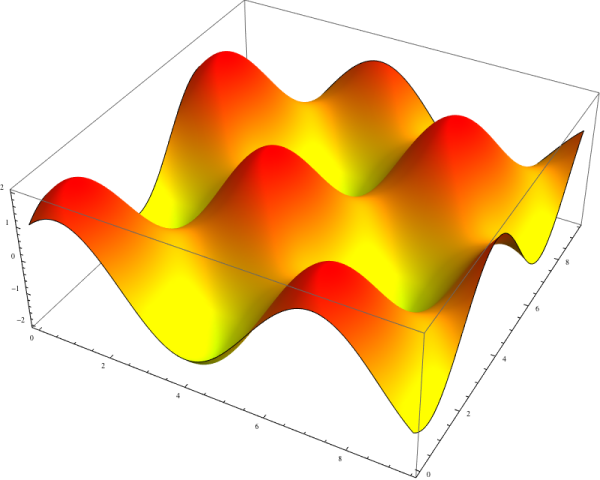
=\sin(x+y)+\cos(x-y)") can be shown using three dimensions. In this case we look over a range of possible values of x and y and create a surface where the height is given by the value of the function.
can be shown using three dimensions. In this case we look over a range of possible values of x and y and create a surface where the height is given by the value of the function.

=(\sin(x+y)+\cos(x-y), \frac{30}{x^2+y^2+30})") the first number gives the colour as above, the second lets the colour fade with the function creating a fade as we go further from the bottom left corner:
the first number gives the colour as above, the second lets the colour fade with the function creating a fade as we go further from the bottom left corner: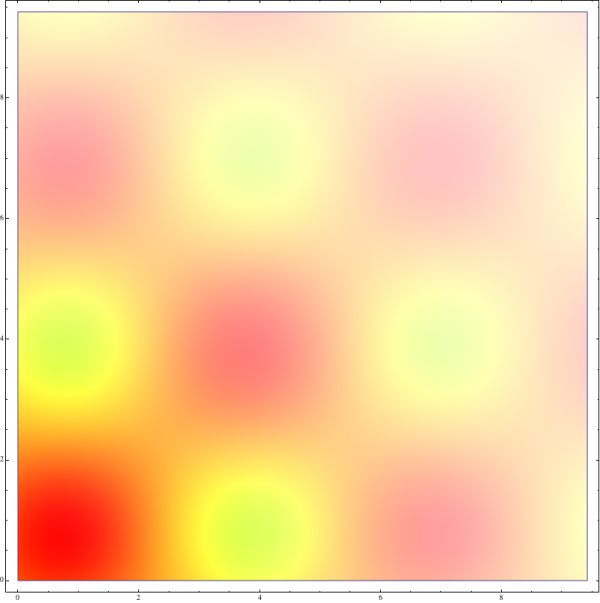


 = -z(z+1)(z-1)") :
: = i z(z^2-i)") :
: 


 They can hook together to make all sorts of geometric objects. For example, take three pieces and make a triangle (or something triangle like with wiggly edges)


 Going further the five triangles come together to
  What we are seeing here is the curvature of the surface we are making. The triangle with 72 degree angles can be said to have an excess of 36 degrees. The greater the excess the more it curves. Look at this triangle with 90 degree angles (for a total of 270 degrees, an excess of 90 degrees), the curvature is very clear:
 Completing this creates a
  This new ball has eight faces, each with a 90 degree excess. Adding all these together gives a total excess of 720. The first model has 20 faces, with a 36 degree excess, and again a total of 720. Lets think about the model with just three triangles around a corner:
 The total angle is 120*3 = 360, so the excess is 180 degrees. If the pattern holds we should need 4 of these triangles to
  In fact if you take anything that is like a sphere, take the angle excess on every face you will always get 720. For a more complex example take
  This has eight triangles and eighteen squares, and all the angles are 90 degrees. For the square this is normal the total interior angle of a quadrilateral should be 360 and 4*90 is 360. So there is no angle excess. This leaves the eight 90 degree triangles once again giving 720. Also notice in the model the square faces are flatter with the curvature occurring at the triangles. This gives the model the shape of a cube with rounded edges, rather than a sphere.
 The saddle is said to have negative curvature, and connecting up more and more squares, like this does not create a ball connecting up on itself. Instead it gives this wavy surface that grows faster and faster, modelling a
  Final note: The curvature discussed here is actually called
  This is covered with equilateral triangles with 60 degree angles. So although it looks curved the geometry is flat, the triangles all have no angle excess. In other words if you investigated distances just on the surfaces of the model they would be the same locally as those on the locally flat plane of triangles given above. You can only detect the change if you loop back on yourself round the cone. The only exception is the tip of the cone. Here you can see a piece is left hanging.


 These shapes provide the climax of
  There is a reasonable argument that each of these must be close to a ball due to the high symmetry. This is a little stretched for the tetrahedron, but we will give it a pass. Can we do anything else with these pieces? To make a sphere we want to have the same amount of curvature everywhere. This does not require that every shape created have the same number of sides and the same angles at the corners, but that seems to be a useful place to start. Then at least every face has the same total curvature. In addition as all the angles on an individual curvahedra piece are the same, the angles around a corner should be the same. These conditions lead us to the

 That does leave two Catalan polyhedra though, the
  They use 3 and 4 connectors (dodecahedron) and 3 and 5 connectors (triacontahedron) arranged to make rhombs


